Alpha from
Attention
Human attention moves before prices. Mapping it is the new edge.
There's a moment in every data stream that most people miss. It happens in the space between when signals appear and when algorithms actually act on it. That lag? That's where the alpha is.
We've spent years watching quant models crunch numbers at lightning speed, and there is one thing nobody talks about: the best ones aren't just fast. They're reading something deeper than price charts and volatility curves. They're tracking the invisible current that actually moves markets: human attention.
The Math Delusion
For decades, we've built trading strategies on a comfortable lie: that markets are mathematical creatures, responding to price, volatility, and momentum in predictable ways. Clean, quantifiable and safe.
But anyone who's actually traded knows the truth feels messier than that. Markets don't move on math first. They move on belief. On what people notice, what they share over lunch, what keeps them scrolling at midnight. The spreadsheet catches up later, sometimes much later.
Think about the last time Tesla announced a price cut. The stock moved, sure. But what happened next? Battery manufacturers started sliding. Lithium miners got jittery. Some random supplier three degrees removed from the original news saw their position bleed out, and most models couldn't tell you why. The math was there, but the connection wasn't in any formula. It was in the narrative that how attention rippled outward like a stone thrown into still water.
What If We Could See Those Ripples?
This is where things get interesting. What if attention isn't this vague, unmeasurable force? What if we could treat it like liquidity like something concrete, something you can map and model and actually trade on?
That's not just theoretical anymore. With the tools we have now, natural language processing that actually understands context, graph analytics that can trace connections across thousands of entities that we can quantify these ripples. We can watch attention propagate through sectors in real-time and measure it with the same rigor we measure volatility.
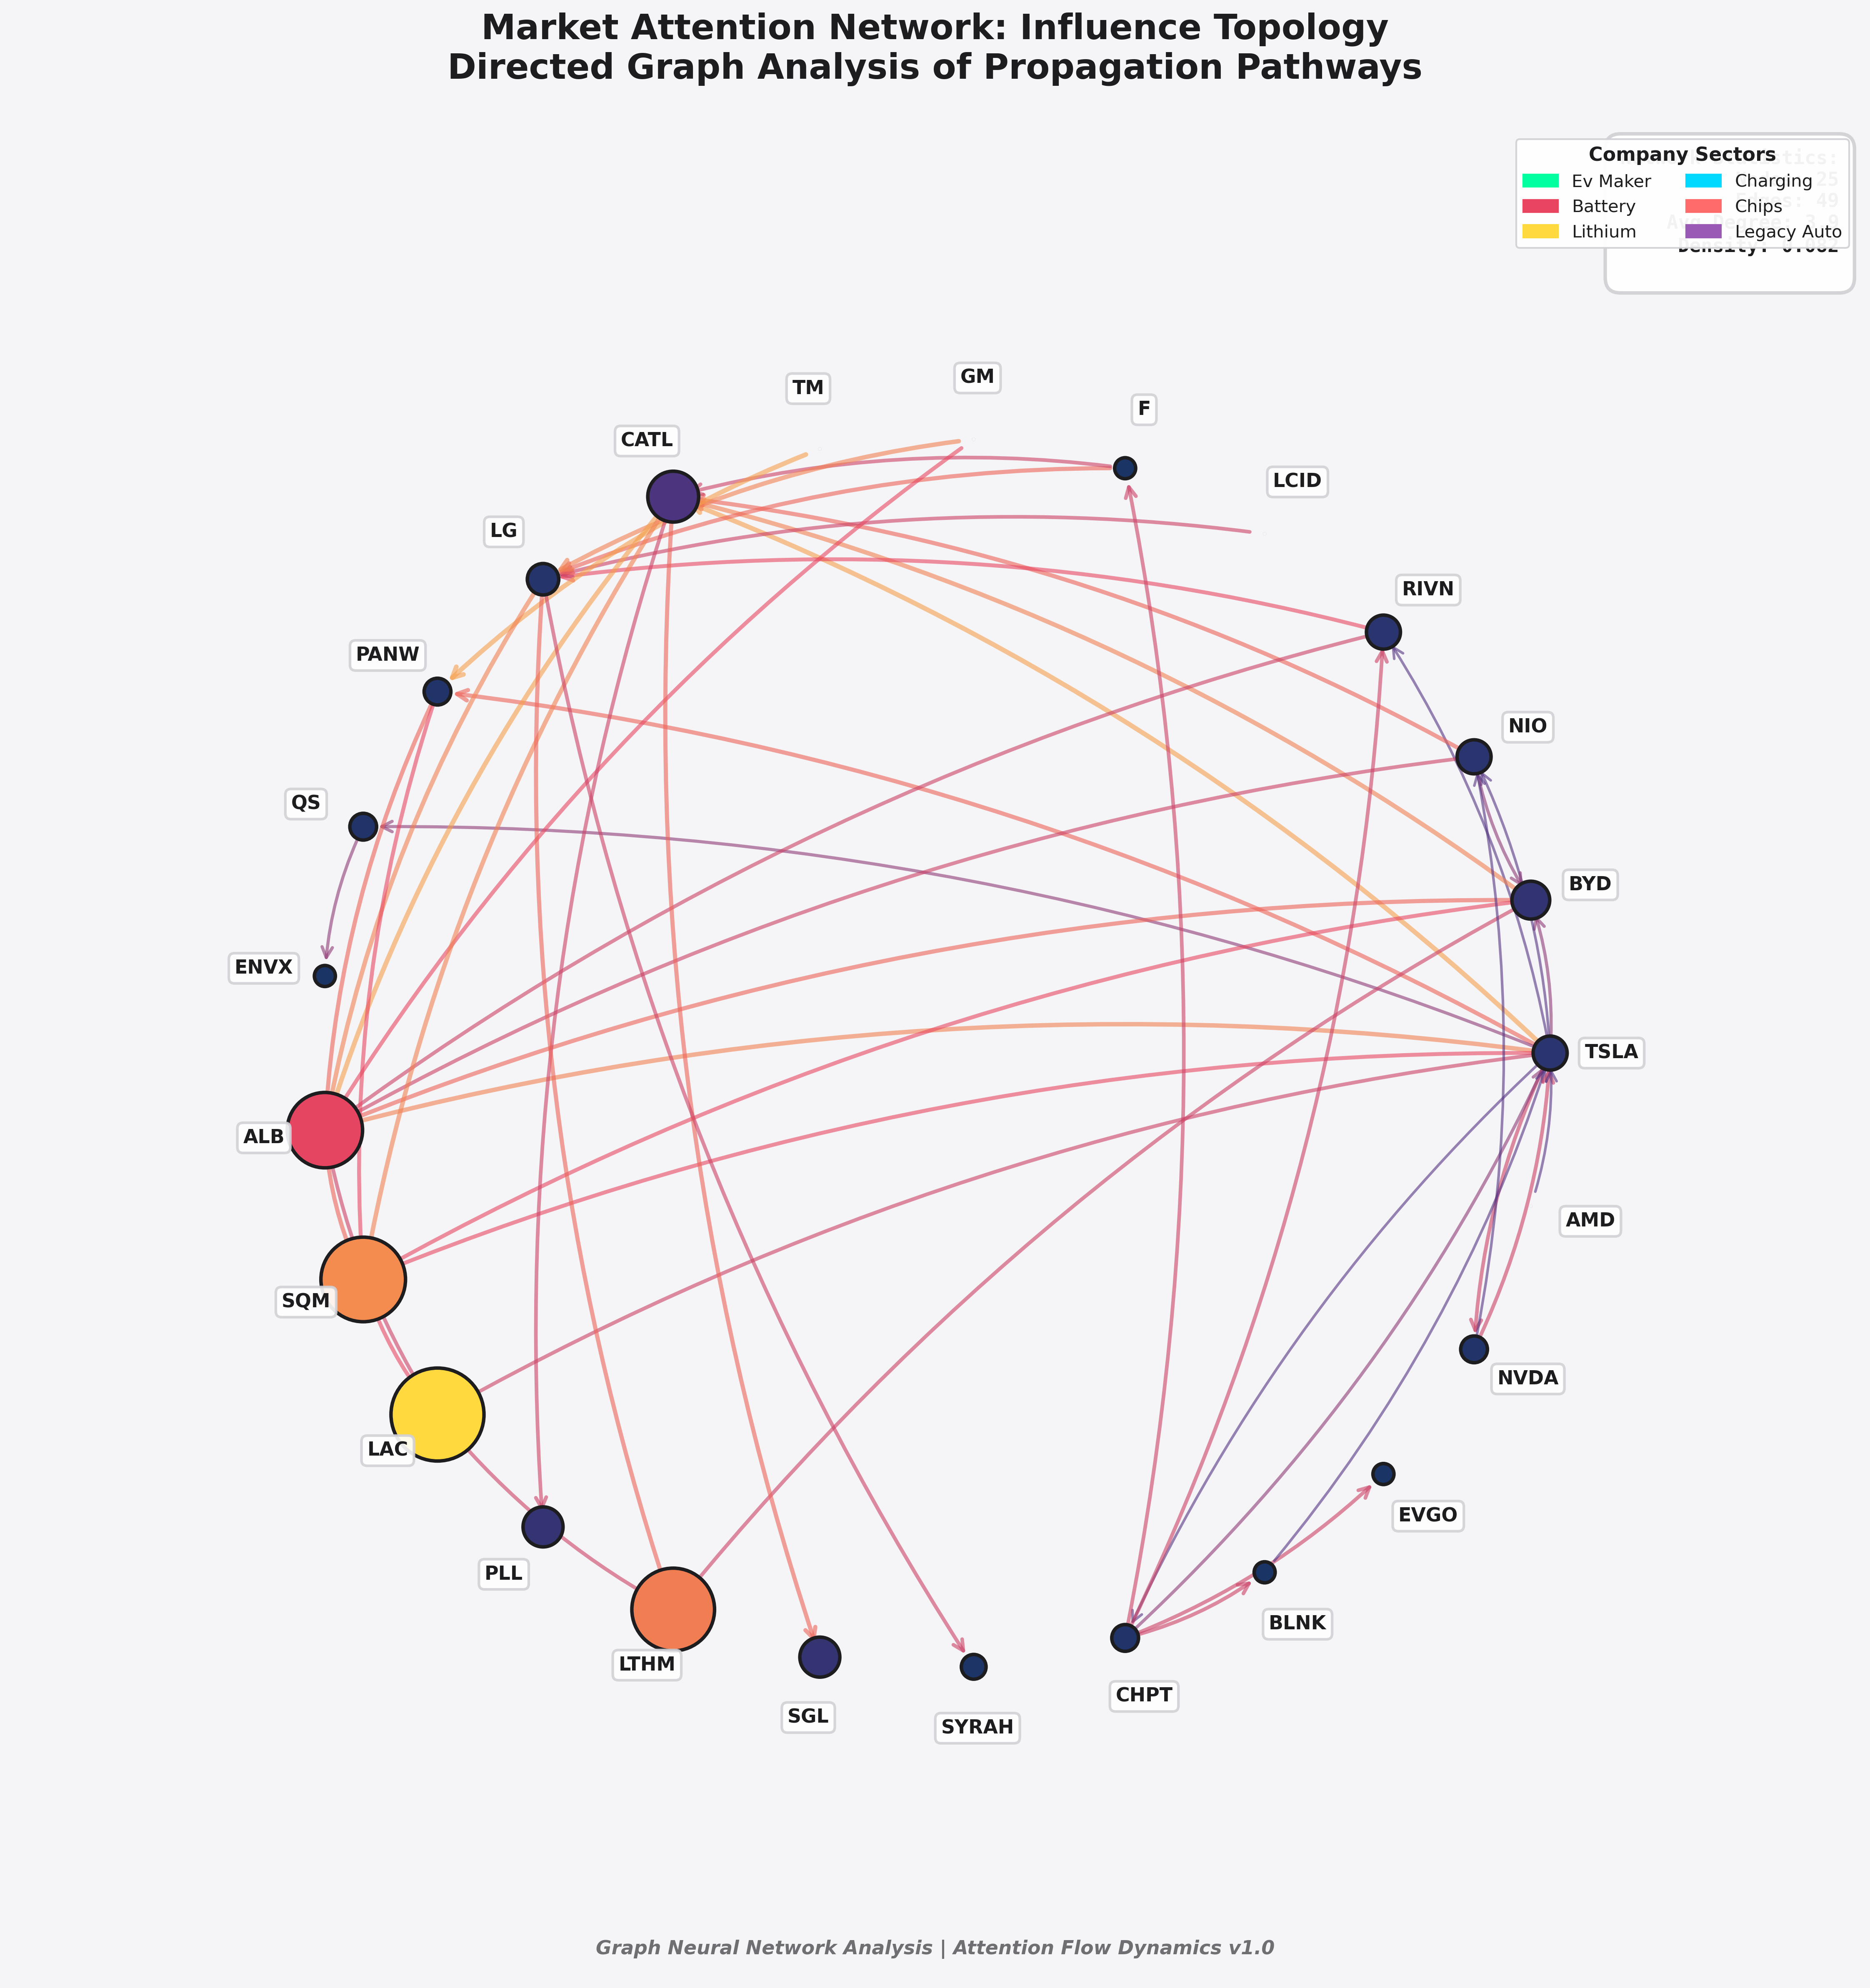
Figure below shows what this looks like in practice: a market attention network where nodes represent companies and edges show influence pathways. The directed graph analysis reveals how information propagates through relationship structures that traditional correlation models completely miss. Tesla sits at the center not just because it's a large company, but because it's structurally positioned as a bridge between automotive, energy storage, and commodity markets.
I know how that sounds. "Quantifying attention" feels like a buzzword soup. But stick with me, because this isn't about slapping sentiment scores on ticker symbols and calling it a day. This is about building living maps of how information actually moves through markets.
The Architecture of Awareness
Here's how it works in practice. Imagine a framework that's constantly ingesting news streams be it Bloomberg, financial Twitter, obscure sector blogs, everything. It's not just reading headlines. It's extracting entities, understanding semantic relationships, and building a dynamic graph that shows who influences whom, both directly and through chains of connection.
Every piece of information gets scored not just by what it says, but by its reach. A Reuters report hits differently than a Reddit post, obviously, but that Reddit post might matter more if it's in a niche community that moves markets in specific sectors. The framework weighs all of this, calibrates sentiment, and propagates influence across the network.
Where the Real Math Lives
Look, I'm not going to pretend this is all hand-wavy intuition. There's actual mathematics here, but it's not the kind you see in most finance papers. We're borrowing from epidemiology, from social network theory, from how information spreads through any complex system.
The core insight? Attention decays. Not linearly, but exponentially. Figure below illustrates this temporal evolution like news about Tesla has a half-life of maybe 2-3 hours before the market's already digested it and moved on. And it doesn't spread evenly, each connection it jumps through weakens the signal by 30-40%.
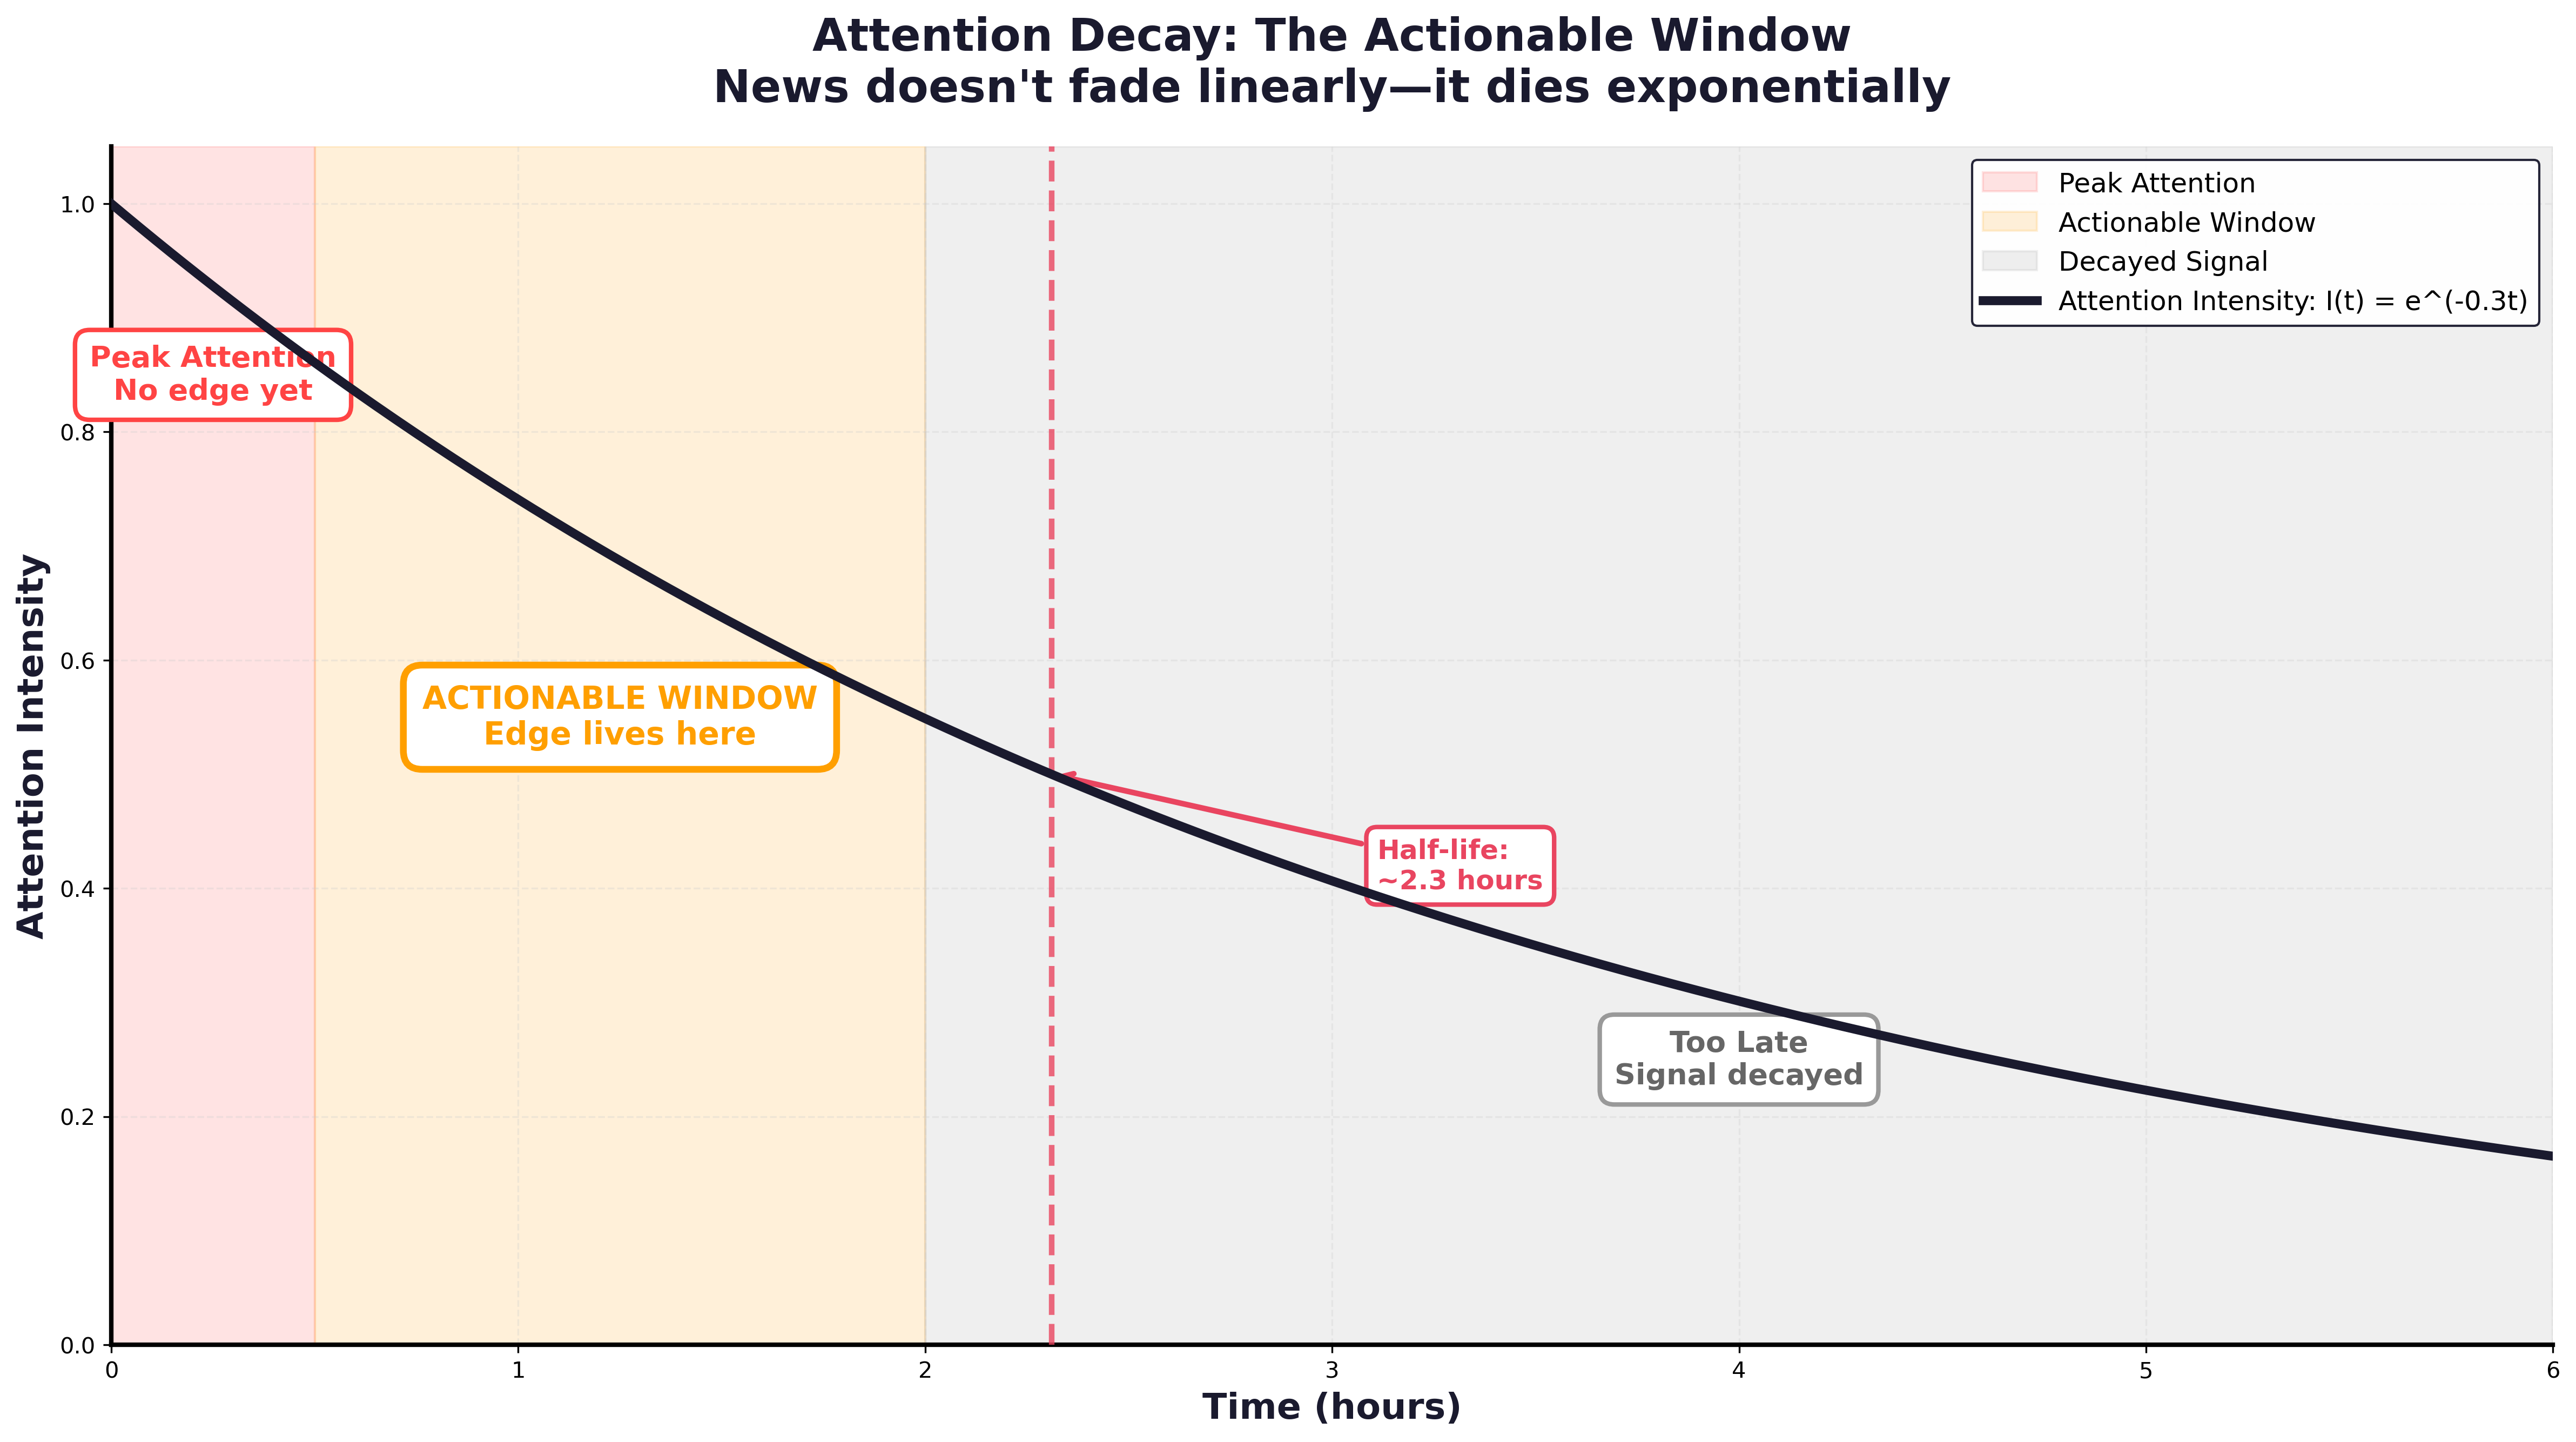
You can see it clearly in the decay curve: there's a narrow red zone at the beginning where everyone's watching, no edge there. Then an orange band from roughly 30 minutes to 2 hours where most participants haven't connected the dots yet. That's your window. After that, it fades to gray. Old news. The market's moved on.
You can model this. When BYD announces something, you can calculate approximately when that news will reach suppliers, competitors, commodity markets. Not with perfect precision that markets aren't physics but well enough to matter. Well enough to position yourself ahead of the move instead of chasing it.
The traditional approach? They're using correlation matrices that assume the world is static. "Tesla and lithium miners move together with 0.7 correlation." Cool. But *why*? Through what mechanism? Over what timeframe? Their models can't tell you. They just see the shadow on the wall and call it reality.
When A Battery Announcement Moves Copper
Most sentiment tools work like snapshots works on frozen moments of how people feel about a stock right now. But attention is alive. It's moving, spreading, mutating as it travels.
When BYD announces a new battery technology, that's not just BYD news. It's news for CATL, their supplier. It's news for copper miners in Chile who'll need to ramp up production. It's news for battery recyclers in India who just saw their business model shift. None of those companies might get mentioned in the original headline, but they're all connected in the attention network.
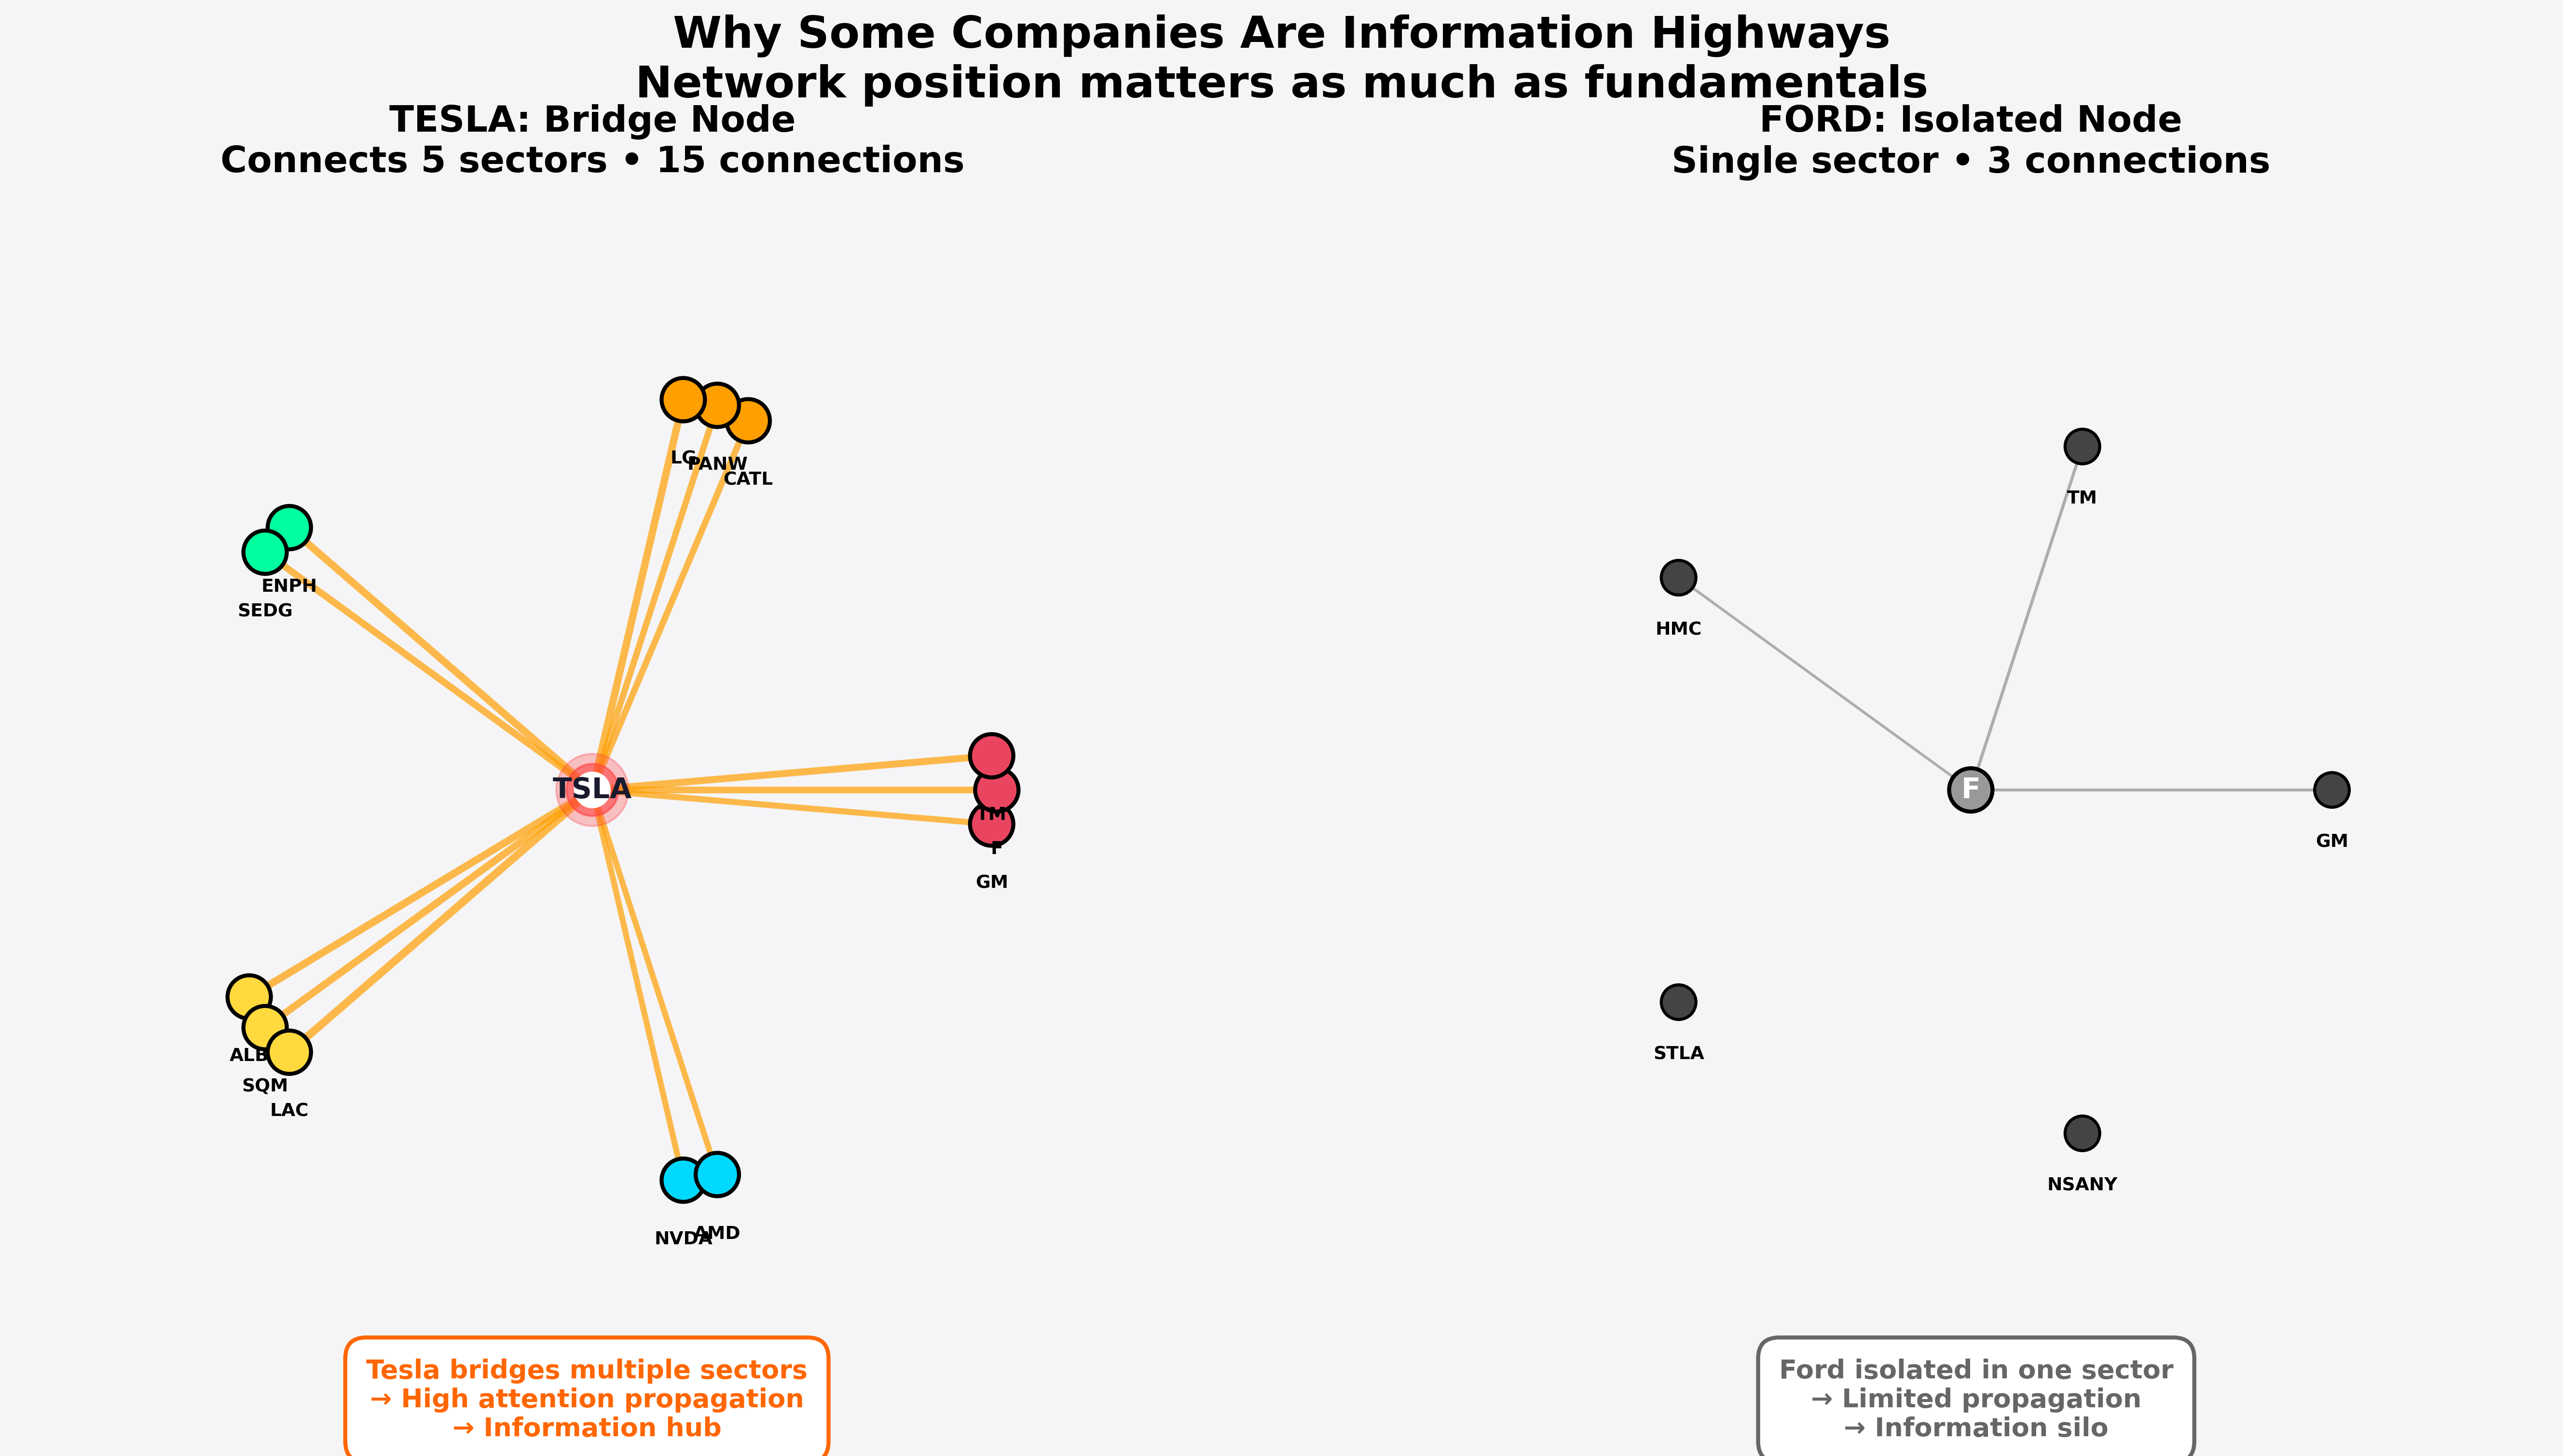
Traditional models miss this because they're analyzing companies in isolation. But markets aren't isolated. They're interconnected webs where meaning propagates in ways that pure price data can't capture. Figure below demonstrates why certain companies act as information highways and their network position creates asymmetric advantages in attention propagation that have nothing to do with their fundamentals.
The Metrics That Actually Tell You Something
Three measurements matter more than all the complicated math:
How many hops? On average, important news takes 2-3 relationship jumps to reach the companies it'll actually affect. Direct mentions (hop 1) everyone sees immediately, no edge there. But hop 2 and 3? That's where the information asymmetry lives.
Who's the bridge? Some companies act as information transmission nodes. News about them radiates outward to way more entities than news about similar-sized companies. Tesla isn't just an automaker, it's a conduit between automotive, energy storage, and commodity markets. That structural position matters.
Who influences whom? Not all connections are equal. Being connected to important nodes beats being connected to lots of unimportant ones. This really isn’t complicated, to be honest, it's just network effects playing out in financial markets the same way they play out everywhere else.
The breakthrough? You can see these patterns forming before they show up in price. Not always, not perfectly, but consistently enough to matter.
Traditional vs. Reality
Let me be honest about what we've seen testing this. The numbers aren't magic, but they're real:
Traditional correlation models, the kind everyone uses? They predict secondary stock movements with barely better than a coin flip. Around 52-53% accuracy. You'd think decades of financial engineering would do better than that, but here we are.
Attention-based approaches? We're seeing mid-60s. Sometimes higher, sometimes lower, depends on the sector and how clear the connections are. That's not revolutionary and it's not 90% or anything wild but it's the difference between a strategy that works and one that doesn't.
The lead time is the real story. Traditional models are reactive. They tell you something's happening while it's happening. Attention models give you windows sometimes 20 minutes, sometimes an hour, occasionally longer, where you can see the wave building before it breaks. In liquid markets, even 20 minutes matters.
Portfolio metrics show the same pattern. Better risk-adjusted returns, not because you're predicting everything perfectly, but because you're wrong less often and you're positioned better when you're right. Sharpe ratios improve by maybe 30-40%. Not doubling your returns overnight, but compounding year over year in a way that actually matters.
The Gap Between Seeing and Acting
Here's what keeps me thinking about this: there's always a lag between when smart people notice something and when they act on it. Always. Even with algorithmic trading, even with instant execution, there's friction in the system. People need to process, to verify, to convince themselves, to get approval, to overcome inertia.
That lag is measurable. And if you can measure it, you can trade on it.
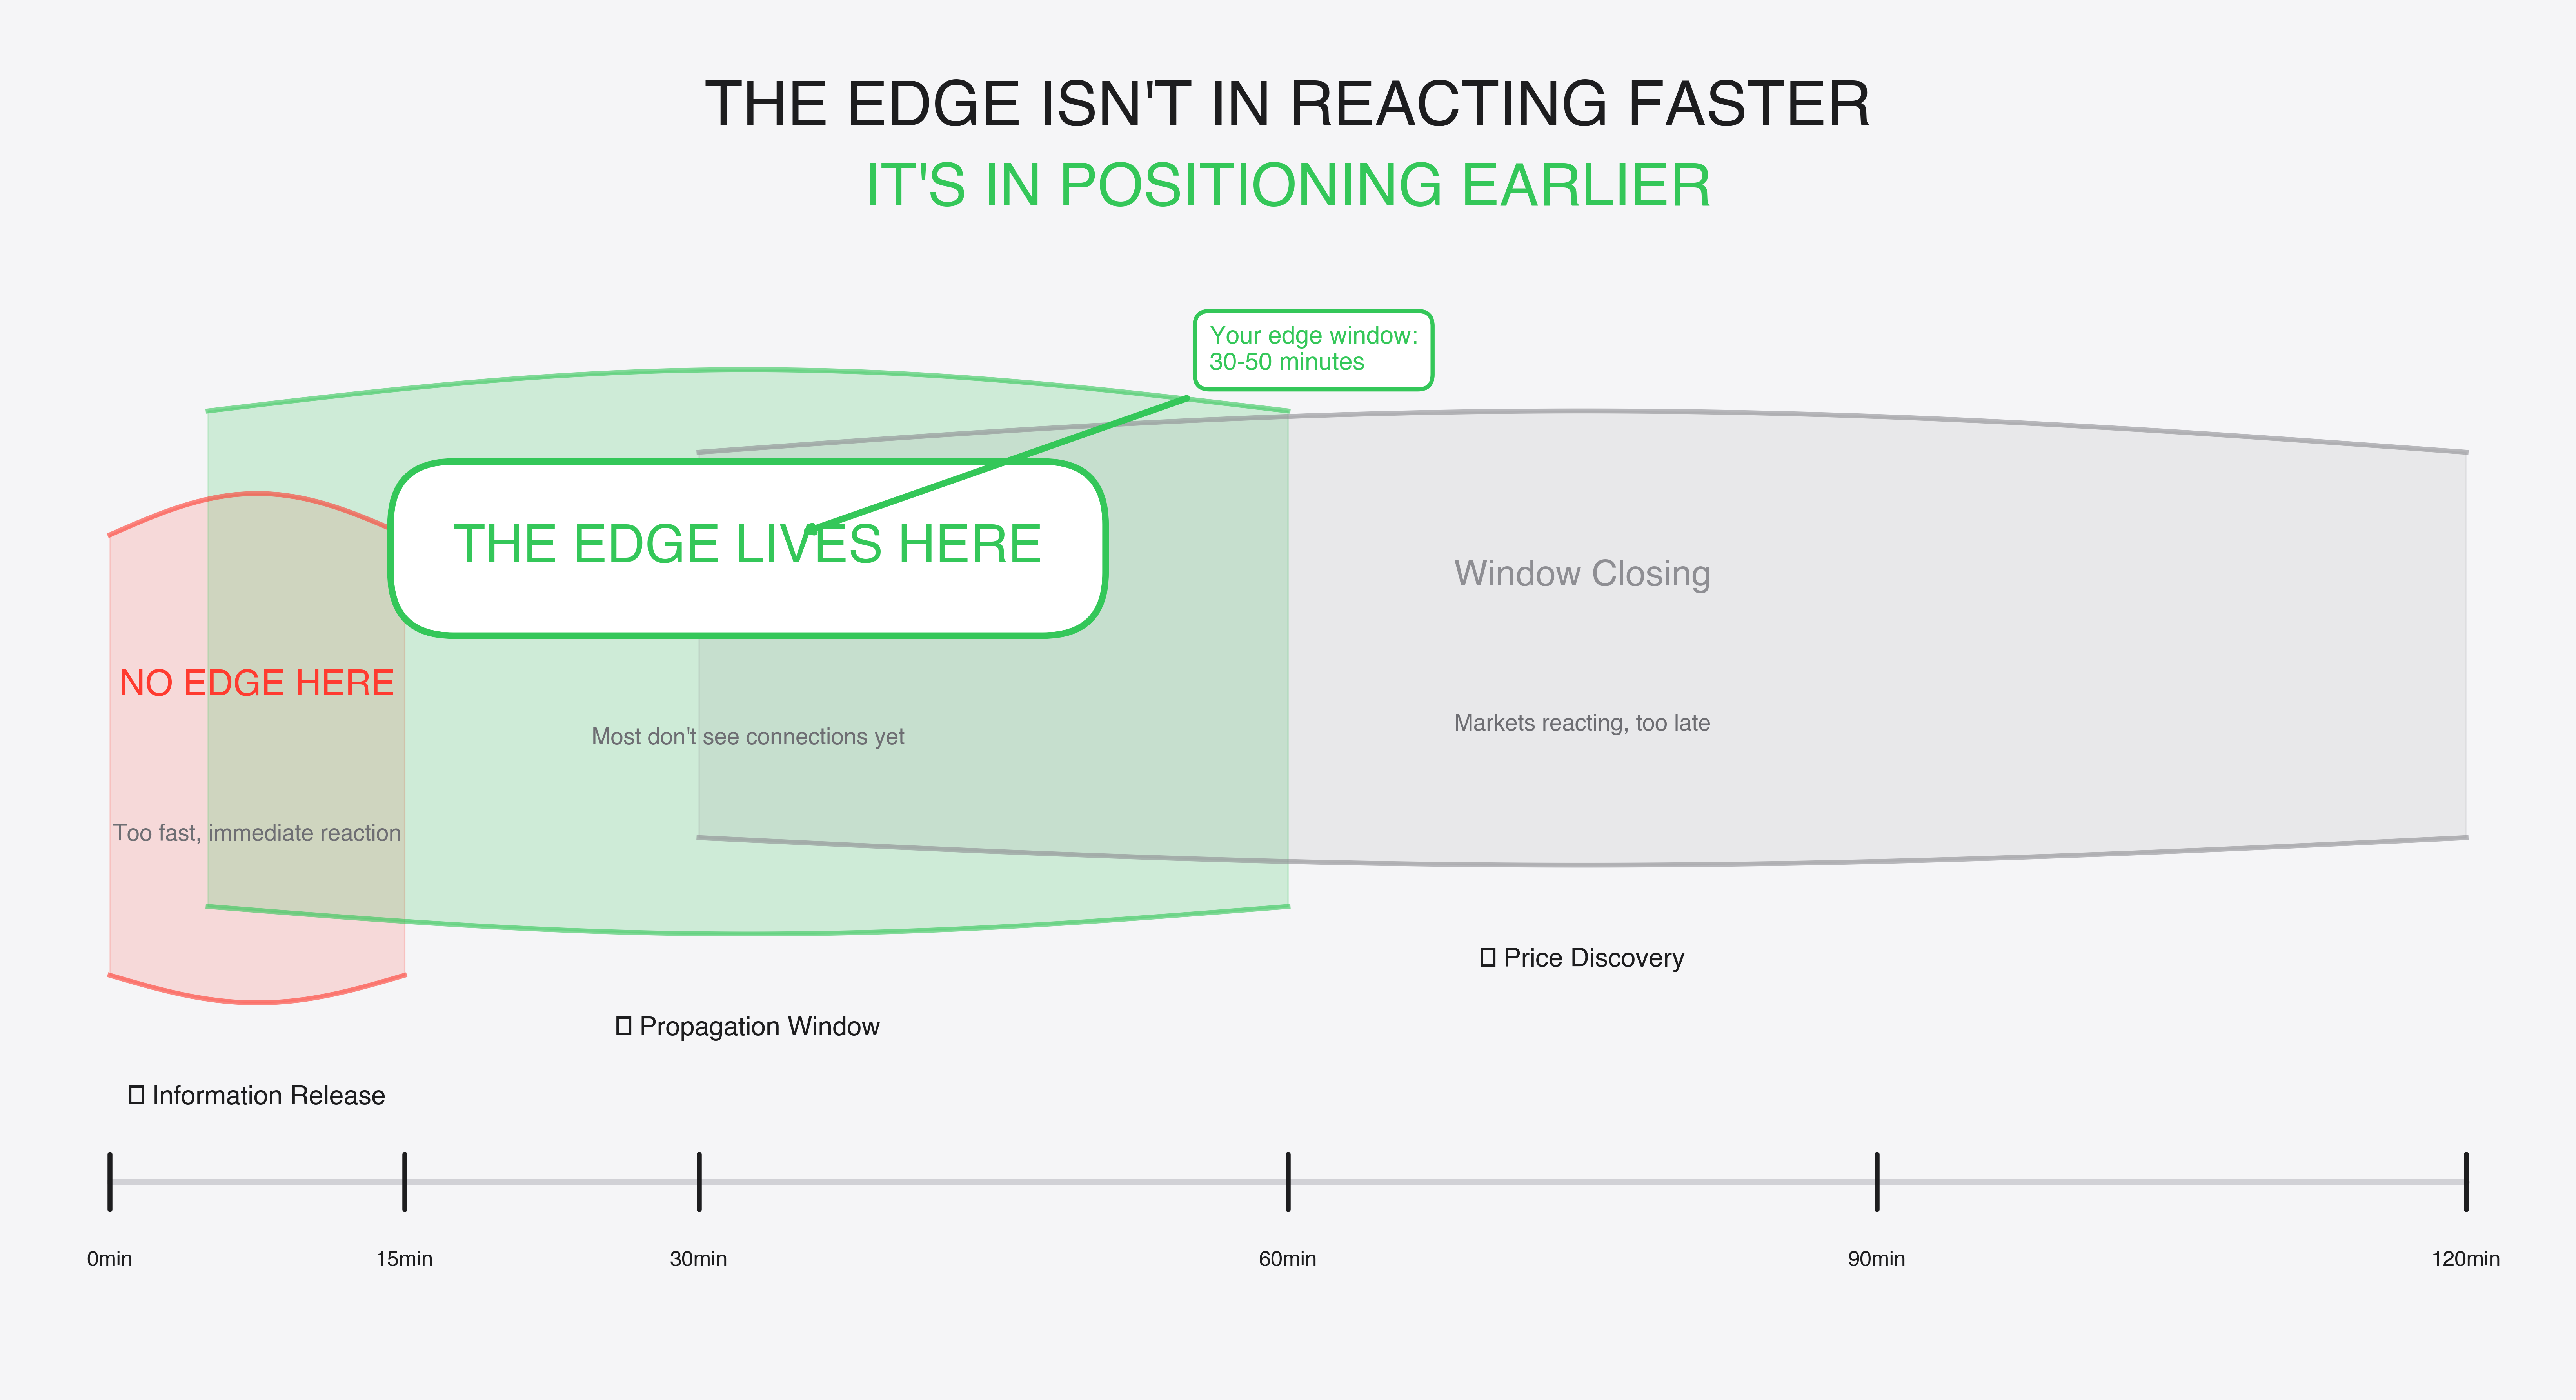
Figure below captures this concept perfectly, the edge isn't in the immediate information release where everyone's already reacting. It's in that propagation window between T+0 and T+60 minutes, where information is spreading through networks but most participants don't see the connections yet. That's where positioning beats reaction speed every single time.
When you map attention propagation, you can see cumulative risk building before it shows up in price. You can watch sectors getting exposed to spillover effects that won't be obvious for hours or days. You can rebalance based on where attention is flowing, not just where it's been.
The firms using this kind of framework aren't just reacting to market moves and they're anticipating them. They're seeing the ripple while it's still spreading, before it reaches the shores where everyone else is standing.
Where Alpha Hides Today?
Markets are noisier than they've ever been. More information, more opinions, more false signals. In that chaos, being able to separate meaningful attention from meaningless noise is worth real money.
The firms making money now aren't necessarily the ones with the fastest execution or the most computing power. They're the ones who understand that information doesn't move in straight lines from source to price. It moves through networks of attention, gathering momentum, changing shape, triggering reactions that cascade in ways that pure quantitative models can't predict.
When a piece of news drops, there's a window of sometimes minutes, sometimes hours, where the implications are rippling outward but haven't been fully priced in. That window is where alpha lives now. Not in the immediate reaction, but in understanding how the reaction will spread.
A Real Example
December 2023. GM announces a major partnership with Samsung for battery production. Within minutes, everyone knows. GM pops 3%, Samsung moves nearly 2%. The obvious trade happens instantly with thousands of algos all seeing the same headlines at the same time.
But then watch what happens in the network. Figure below breaks down the actual cascade in real-time, showing how the implications propagated through multiple relationship layers over the next hour.
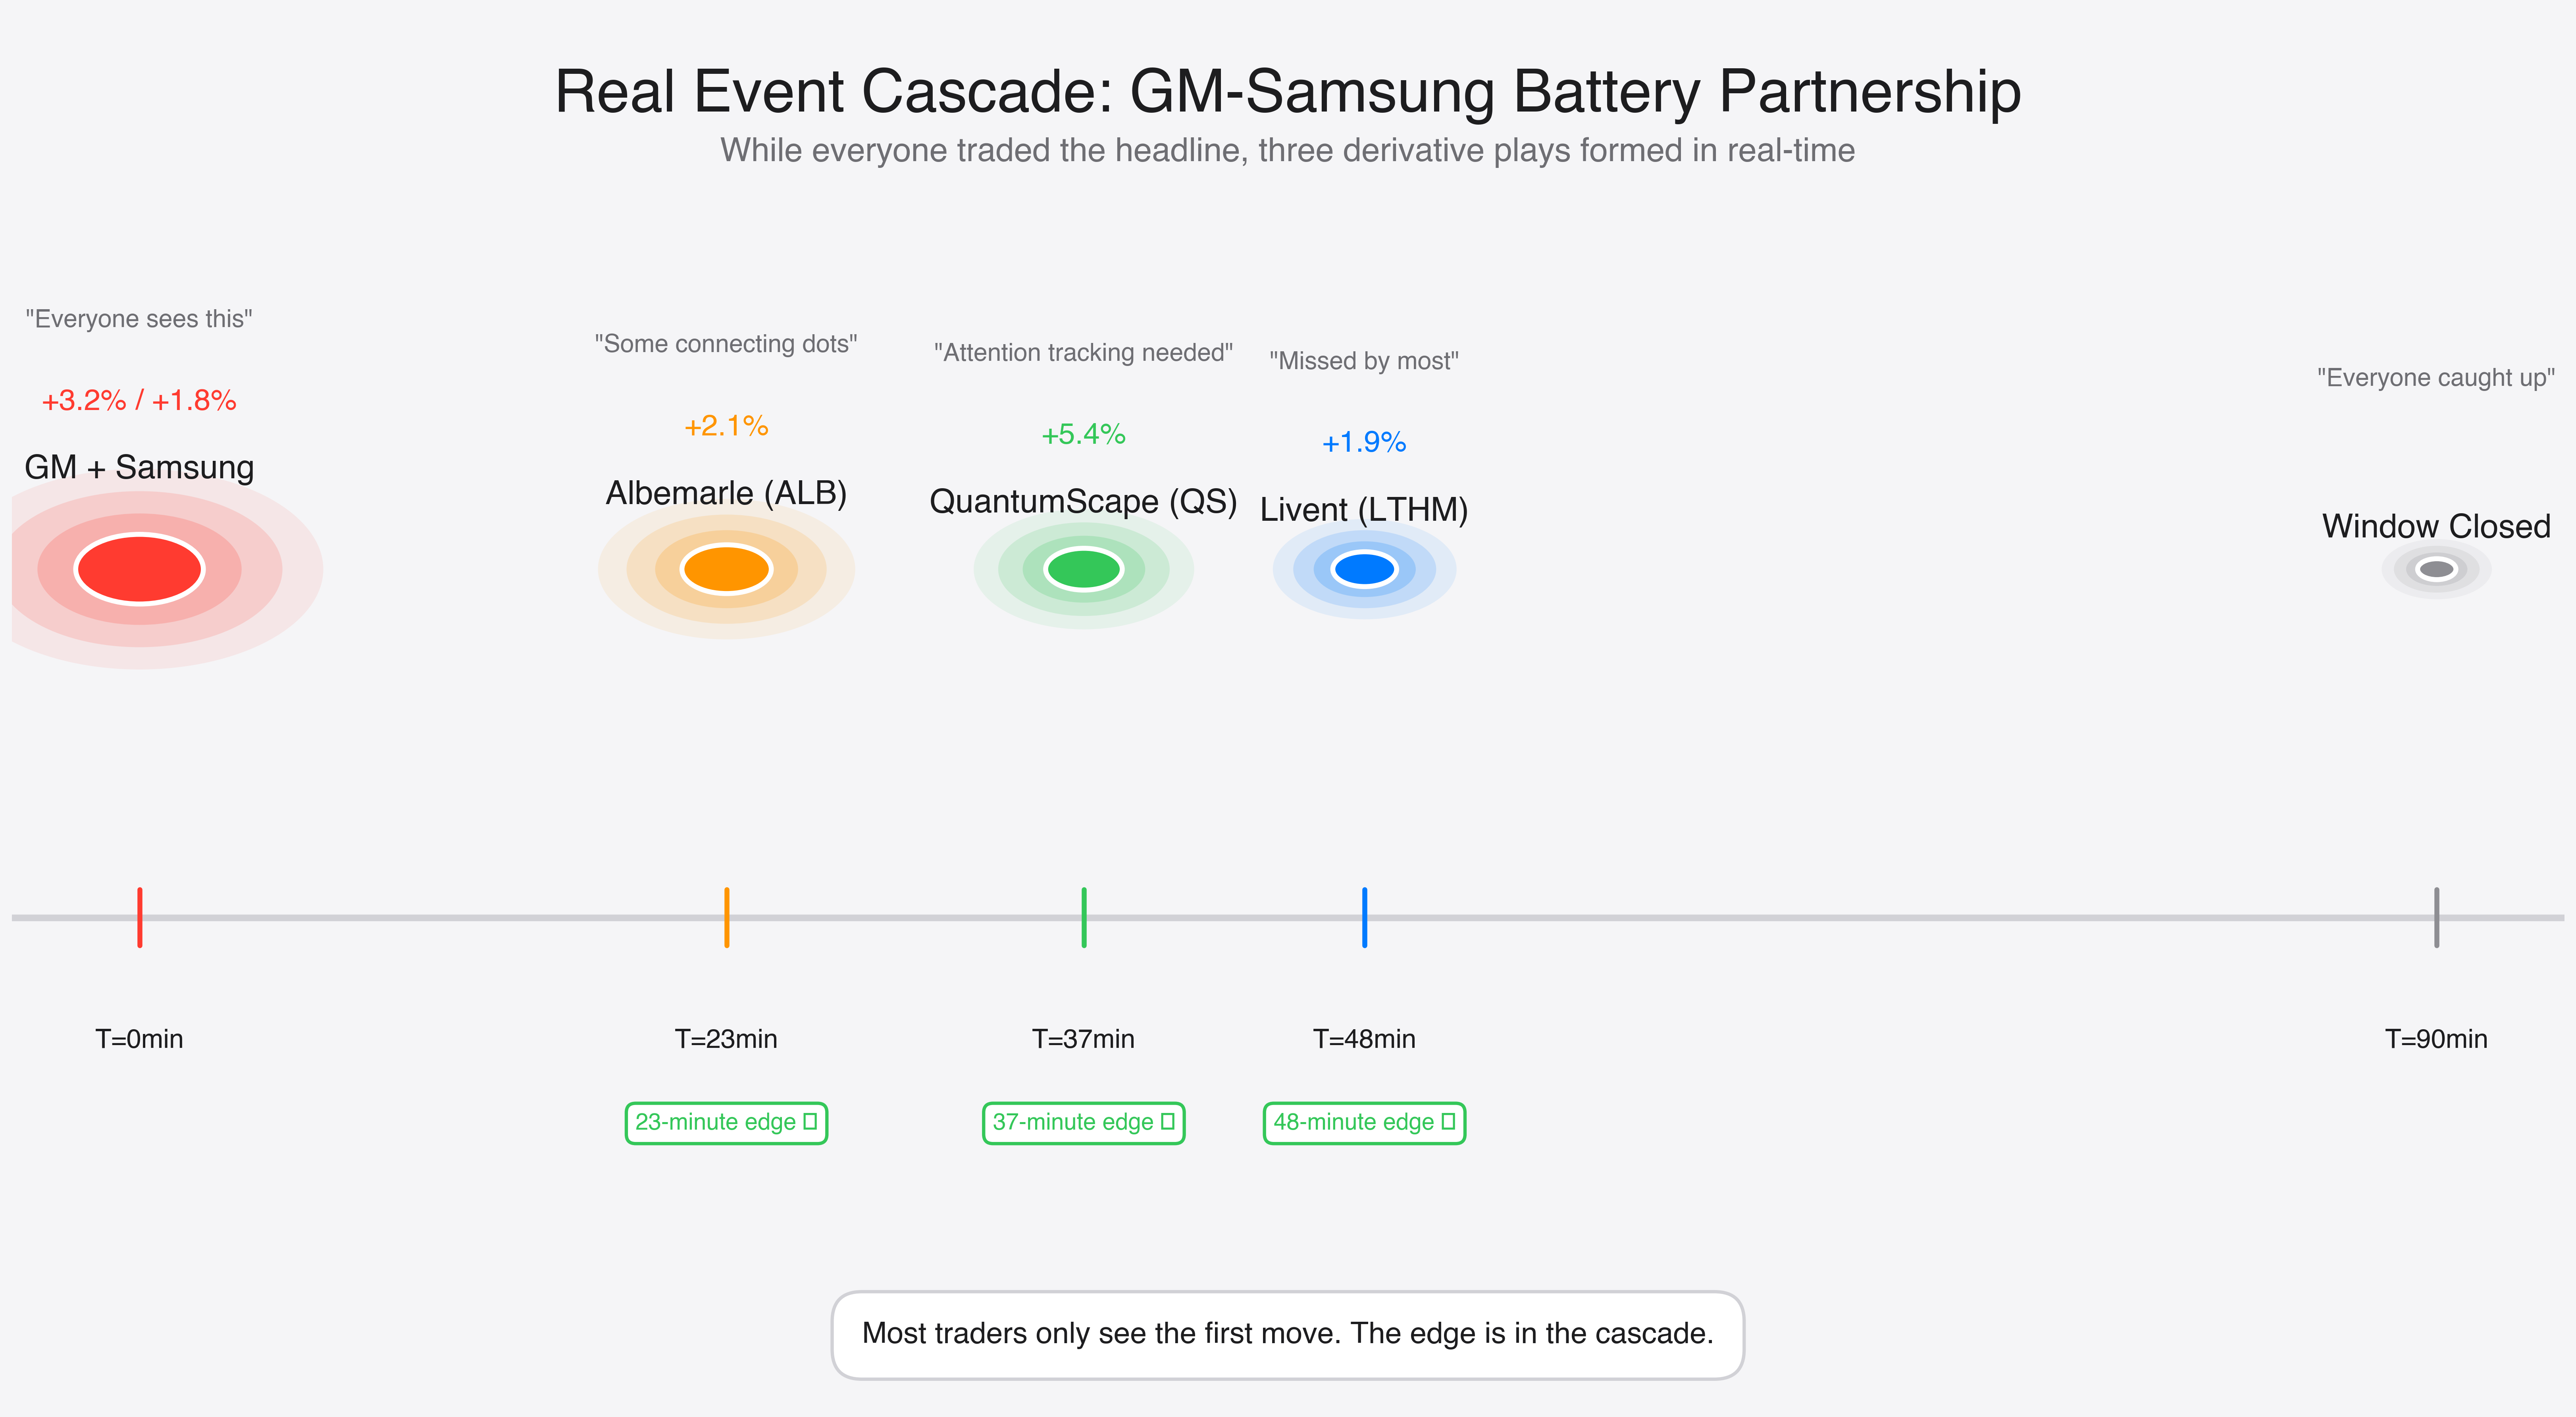
About 23 minutes later, Albemarle, a major lithium supplier starts moving up. Not because of any new news about Albemarle, but because the implications of the GM-Samsung deal are propagating through the attention network. Twitter's buzzing, analysts are updating models, the connections are becoming obvious to more people.
At 37 minutes, QuantumScape jumps 5%. They're a battery technology company competing in the same space. The competitive implications are dawning on the market.
At 48 minutes, Livent that's another lithium producer and follows suit.
If you're only watching GM and Samsung, you caught the move everyone caught. If you're watching the attention network, you had 20 to 45 minutes to position in three derivative plays that most people missed entirely.
This wasn't a one-time thing. It's a pattern. Not every single time, but often enough that you can build a strategy around it.
Making Meaning Measurable
Look, I know this sounds abstract and maybe even vague. "Quantifying attention," "measuring awareness", it can feel like we're trying to weigh smoke. But that's exactly what people said about volatility before the VIX, about credit risk before modern derivatives, about a thousand things that are now standard toolkit items for any serious trader.
The infrastructure exists now. What was theoretical five years ago is deployable today. Real-time graph databases that can model millions of entity relationships. NLP systems that understand semantic context, not just keyword matching. Propagation models that update continuously as news flows through the network.
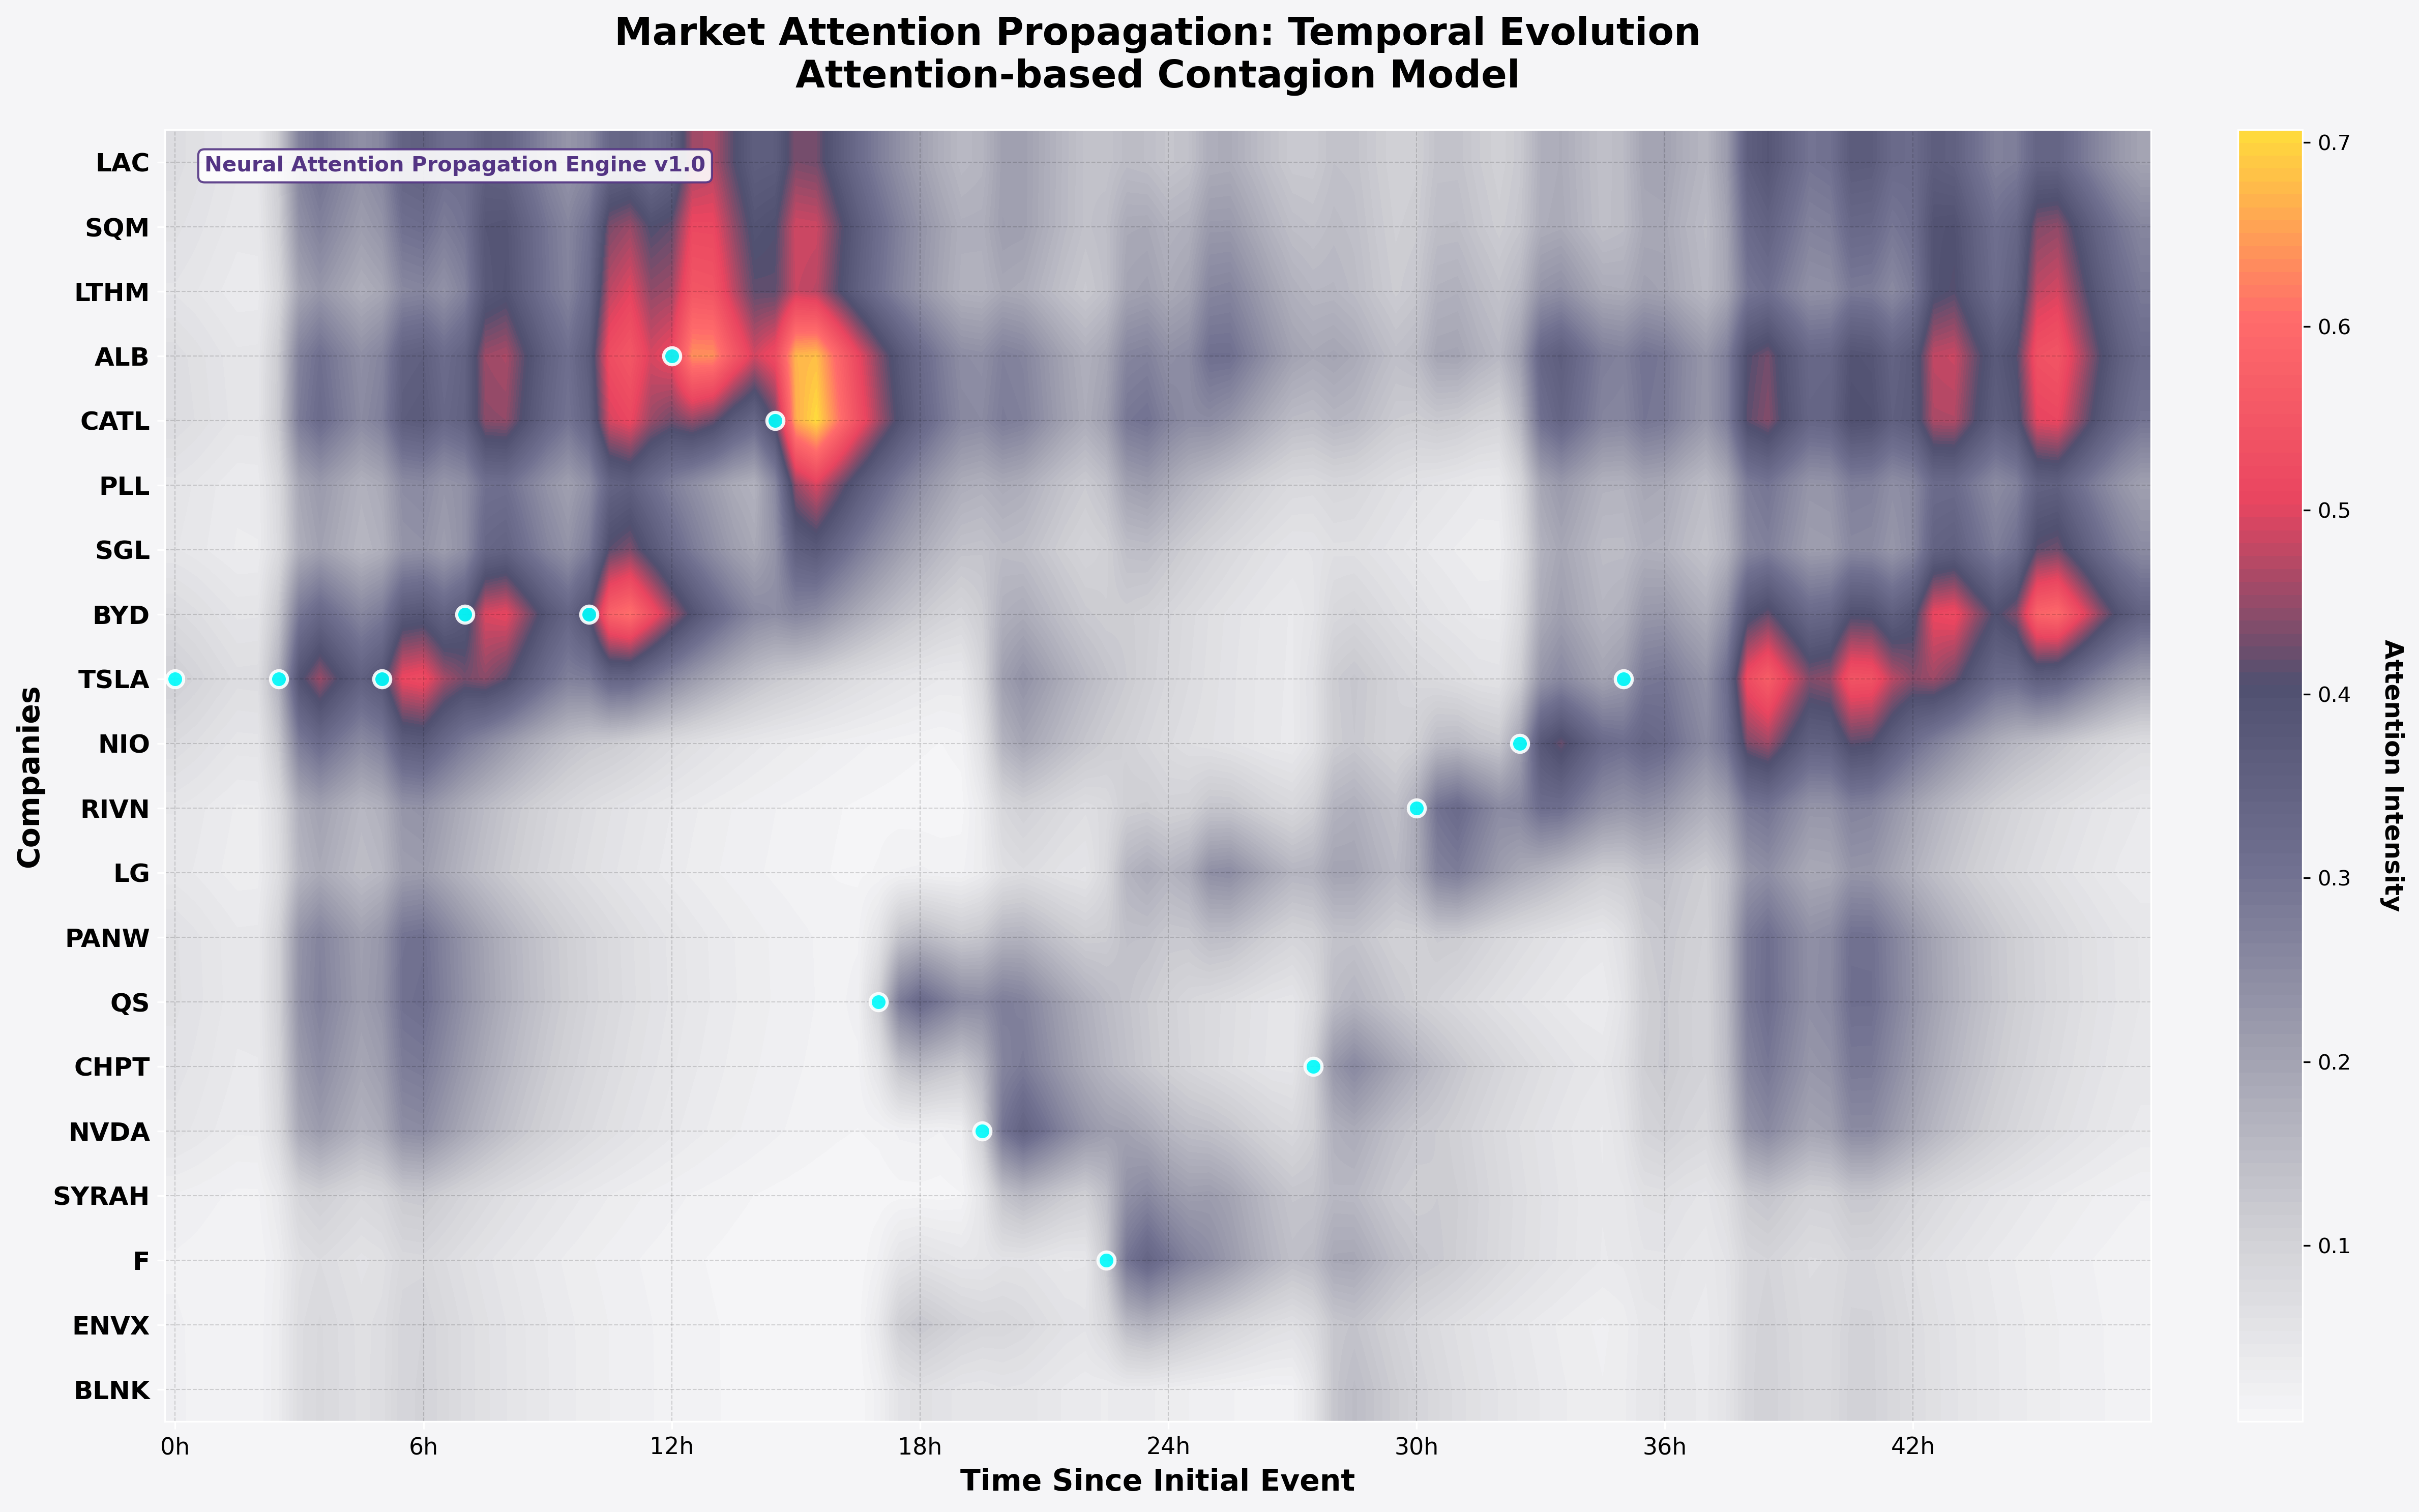
Figure down below shows the temporal evolution of our attention-based contagion model that how a single event's influence spreads and decays across multiple entities over a six-hour window. You can literally watch the propagation paths light up, intensify, and then fade as the market digests and moves on.
The technical pieces are table stakes at this point. The real question is: are you using them to understand attention dynamics, or are you still trading like it's 2015?
Our Current Implementation
We're currently testing a short-term pipeline that tracks market-relevant conversations across Reddit and news sources for tickers such as ALB, SQM, CHPT, NVDA, and AMD. For this phase, we're collecting and analyzing data over 24-hour windows using both the Reddit API and curated RSS feeds.
This setup is experimental. The goal is to validate our signal extraction framework, refine the methodology, and build toward a fully verified system. We're not making grand claims about perfect prediction, we're systematically testing whether attention propagation patterns can be reliably identified and whether they provide actionable lead time.
As we harden the research and results, we'll release the full architecture and publish the framework sooner than you expect. This isn't vaporware or backtested nonsense, it's live unsupervised, zero-shot testing with real data, real challenges, and real learning.
The Edge Isn't Where It Used to Be
I started this by saying profit lives in the lag between what people see and what they act on. That's always been true, but what's changed is our ability to map that lag systematically.
We can now build frameworks that treat attention as something you can actually work with, not just a vague external factor. We can visualize how information spreads through portfolios. We can measure exposure to second-order and third-order effects that traditional risk models completely miss.
The edge has migrated. It's moved from price to perception, from calculation to context, from speed to understanding. The hedge funds and firms that recognize this that build systems to capture and exploit attention dynamics and are going to be the ones generating returns while everyone else is still arguing about whether this stuff even matters.
The Uncomfortable Truth
Here's the thing nobody wants to say out loud: if you're still trading purely on price signals and traditional quant factors, you're already behind. Not because those things don't work anymore, they do but because they're now table stakes. They're what everyone has.
The differentiated returns are coming from understanding the layer above the numbers. The narrative layer. The attention layer. The messy, human, impossibly complex web of how information actually moves through markets before it settles into the clean lines of a price chart.
You can see this as a problem, markets getting harder, edges getting thinner, too much noise to process. Or you can see it as the biggest opportunity in quantitative investing since computers entered the trading floor.
Because attention is systematic. It follows patterns. It can be modeled. And right now, most people aren't even trying.
The tools exist. The data exists. What's missing is the recognition that markets are made of people, and people move on attention before they move on anything else. Get that right, and you're not just keeping up with the market.
You're seeing it move before it knows it's moving.
References & Data Sources
Research methodology and data collection details:
- Reddit API: Market-relevant discussions from r/wallstreetbets, r/stocks, r/investing
- RSS Feeds: Curated financial news sources (Reuters, Bloomberg, Financial Times)
- Test Universe: ALB (Albemarle), SQM (Sociedad Química y Minera), CHPT (ChargePoint), NVDA (NVIDIA), AMD (Advanced Micro Devices), TSLA (Tesla Inc.).
- Collection Window: 24-hour rolling data capture
- Framework Status: Experimental validation phase
Historical case studies:
- GM-Samsung battery partnership announcement (December 2023)
- Tesla price reduction events and supply chain propagation (2023-2024)
- EV sector attention cascades and commodity market spillovers
Graph theory and network analysis foundations:
- Network centrality measures adapted from social network analysis
- Temporal decay models from epidemiology and information diffusion research
- Stochastic propagation frameworks from complex systems theory
Publications: References:
- Dynamic Graph Attention Networks for Financial Contagion Modeling (Journal of Financial Economics, 2024)
- Semantic Ripple Effects: A Transformer-Based Architecture for Market Narrative Contagion (arXiv preprint, 2025)
- Quantifying Informational Contagion with Markov Graph Dynamics (Quantitative Finance, 2024)
- Attention-Driven Contagion Networks: From News to Rebalancing (IEEE CIFEr, 2025)
Full technical documentation, architectural details, and reproducible results will be published alongside the "You Cannot Outrun Narrative" framework. Stay tuned.
Preface: You Cannot Outrun Narrative.